SaaS Activation Metrics: What to Track and How to Improve Them in 2026
If there is a single silent killer of Software-as-a-Service (SaaS) businesses in 2026, it is the gap between a new user signing up and that same user actually getting value out of the product. Many founders and growth teams celebrate record-breaking signup numbers, only to watch their monthly recurring revenue (MRR) flatline as those same users churn within the first 30 days. The missing link? SaaS activation metrics.
Activation is the critical bridge between a user simply creating an account (signup) and becoming a long-term, paying advocate (retention). It is the point where the promises made by your marketing and sales teams are finally realized within the product. At NudgeSaaS, we’ve seen firsthand how a hyper-focus on activation can transform a leaking user funnel into a compounding growth engine.
In this comprehensive guide, we will explore exactly what SaaS activation metrics are, the core KPIs you need to track in 2026, how to define your product’s unique activation event, and actionable tactics to dramatically improve your user onboarding experience.
1. What is User Activation (and Why It’s Different from Signup or the ‘Aha Moment’)
To effectively measure and optimize your SaaS activation metrics, we first need to clarify what user activation actually means, because it is frequently conflated with two other concepts: the signup and the “Aha! moment.”
The Signup (The Beginning)
A signup is merely a transaction of intent. A user has traded their email address (and perhaps their credit card information) for access to your software. While this is an important top-of-funnel metric, it tells you nothing about whether the user will stick around. A signup means the user hopes your product will solve their problem, but they haven’t proven it yet.
The “Aha! Moment” (The Emotion)
The “Aha! moment” is the exact second a user emotionally understands the core value of your product. It’s a psychological click. For a video editing tool, it might be the moment a user sees how easily they can remove background noise from a clip. The Aha! moment is crucial, but it is subjective, emotional, and very difficult to track quantitatively in a database.
User Activation (The Action)
User activation is the behavioral manifestation of the Aha! moment. It is the objective, measurable set of actions a user takes that proves they have experienced the core value of your product. Activation is empirical.
For example, if you run an email marketing SaaS:
- Signup: User creates an account.
- Aha! Moment: User sees the beautiful drag-and-drop template builder and realizes how much time it will save them.
- Activation: User actually imports their subscriber list, builds an email, and clicks “Send” on their first campaign.
Activation is the definitive proof that the user has successfully crossed the bridge from “curious visitor” to “successful user.”
2. The Core SaaS Activation Metrics to Track
When building your growth engine in 2026, you cannot rely on a single data point. A robust understanding of your onboarding performance requires tracking a constellation of SaaS activation metrics. Here are the four core metrics every SaaS company must monitor.
Activation Rate
The Activation Rate is the foundational metric of your onboarding funnel. It measures the percentage of users who successfully complete your predefined activation event out of the total number of users who signed up during a specific period.
Formula: (Number of Users Who Reached Activation Event / Total Number of Signups) × 100
Why it matters: Your activation rate is a direct reflection of your product’s usability and the effectiveness of your onboarding sequence. A low activation rate indicates severe friction in the early user journey, meaning your marketing dollars are being wasted on users who never actually experience your product’s value.
Time-to-Value (TTV)
Time-to-Value measures the speed at which a user reaches activation. It is typically measured in days or hours from the moment of signup.
Formula: Timestamp of Activation Event – Timestamp of Signup (Averaged across a cohort).
Why it matters: In 2026, user patience is at an all-time low. If your TTV is measured in weeks while your competitor’s TTV is measured in minutes, you will lose market share. Reducing TTV is one of the highest-leverage activities a product team can undertake. Shorter TTV strongly correlates with higher free-to-paid conversion rates and lower day-30 churn.
Feature Adoption Depth
While overall activation tells you if a user reached a specific milestone, Feature Adoption Depth measures how much of the product they are exploring during their initial lifecycle. It tracks the percentage of core features a new user interacts with during their first 7 to 14 days.
Why it matters: A user might complete the initial activation event but ignore 80% of your platform’s capabilities. Tracking feature adoption depth helps you identify secondary activation points. Users who adopt multiple features are more deeply entrenched in your ecosystem, making them significantly less likely to churn.
Product Qualified Leads (PQLs)
In product-led growth (PLG) models, a Product Qualified Lead is a user who has completed the activation event, matches your Ideal Customer Profile (ICP), and exhibits behavioral signals indicating they are ready for an upsell or a sales conversation.
Why it matters: Unlike Marketing Qualified Leads (MQLs) who have merely downloaded a whitepaper, PQLs have actually derived value from your software. Tracking the volume and conversion rate of PQLs bridges the gap between product activation and actual revenue generation, allowing your sales team to focus on users with the highest intent to buy.
3. How to Define Your Product’s ‘Activation Event’
You cannot measure SaaS activation metrics if you don’t clearly define what “activation” means for your specific product. This is not a one-size-fits-all metric. To define your activation event, use this three-step framework:
- Map the Core Value Proposition: What is the primary reason people hire your software?
- Identify the Bottleneck Action: What is the specific, non-negotiable action a user must take in the product to achieve that value?
- Validate with Retention Data: Look at your historical data. Do users who perform this action retain at significantly higher rates than those who don’t? If yes, you have found your activation event.
Here are examples of how activation events are defined across different SaaS categories:
Project Management SaaS (e.g., Asana, Monday.com)
- Core Value: Organizing team tasks and collaborating efficiently.
- Activation Event: The user creates a new workspace, invites at least two team members, and completes at least one assigned task within the first 7 days.
- Why? A project management tool has no value in a vacuum. Multi-player mode (inviting others) and task completion are mandatory for value realization.
Analytics SaaS (e.g., Mixpanel, Google Analytics)
- Core Value: Understanding user behavior through data.
- Activation Event: The user successfully installs the tracking snippet on their website and creates their first custom dashboard or report.
- Why? Until the data is flowing and visualized, the analytics tool is just an empty shell. Installation is the critical hurdle.
Communication & Chat Tools (e.g., Slack, Microsoft Teams)
- Core Value: Seamless asynchronous and real-time team communication.
- Activation Event: A workspace reaches 2,000 messages sent between multiple users.
- Why? (This famously mirrors Slack’s early activation metric). Sending one message doesn’t build a habit. Reaching a high threshold of messages proves the tool has been integrated into the team’s daily workflow.
4. Benchmark Ranges for Activation Rates
One of the most common questions we get at NudgeSaaS is, “What is a good activation rate?”
The truth is, benchmarks for SaaS activation metrics vary wildly depending on your go-to-market motion, product complexity, and target audience. An enterprise ERP software requiring custom implementation will have a vastly different activation profile than a consumer-friendly AI writing assistant.
However, based on widely reported industry data in 2026, here are general benchmark ranges to help you orient your goals:
- Freemium B2C/Prosumer SaaS (e.g., Canva, Grammarly):
- Typical Range: 25% – 45%
- Because the barrier to entry is zero, many users sign up out of idle curiosity, driving down the overall activation rate. However, the sheer volume of signups compensates for this.
- Product-Led B2B SaaS (Free Trial) (e.g., Notion, Zoom):
- Typical Range: 30% – 50%
- Free trials (especially 14-day or 30-day trials) typically have higher activation rates than freemium models because the time constraint forces the user to evaluate the product quickly.
- Sales-Led Enterprise SaaS (e.g., Salesforce, Workday):
- Typical Range: 70% – 90%+
- In sales-led motions, activation is usually guided by a dedicated Customer Success Manager (CSM) or implementation team. Because the customer has already paid heavily upfront, commitment is high, resulting in much higher activation rates.
The Golden Rule of Benchmarks: Do not obsess over beating the industry average. Obsess over beating your own historical baseline. If your activation rate was 15% last quarter and is 22% this quarter, you are winning.
5. How to Build an Activation Dashboard
Tracking SaaS activation metrics requires a single source of truth. You need an activation dashboard that your product, marketing, and customer success teams can view daily. Here is how to build one effectively:
Step 1: Choose Your Stack
You will need a robust product analytics tool. In 2026, leaders include Amplitude, Mixpanel, PostHog, or specialized onboarding platforms. Your marketing site, backend database, and CRM must all feed event data reliably into this analytics engine.
Step 2: Build the Core Visualizations
A world-class activation dashboard should include the following views:
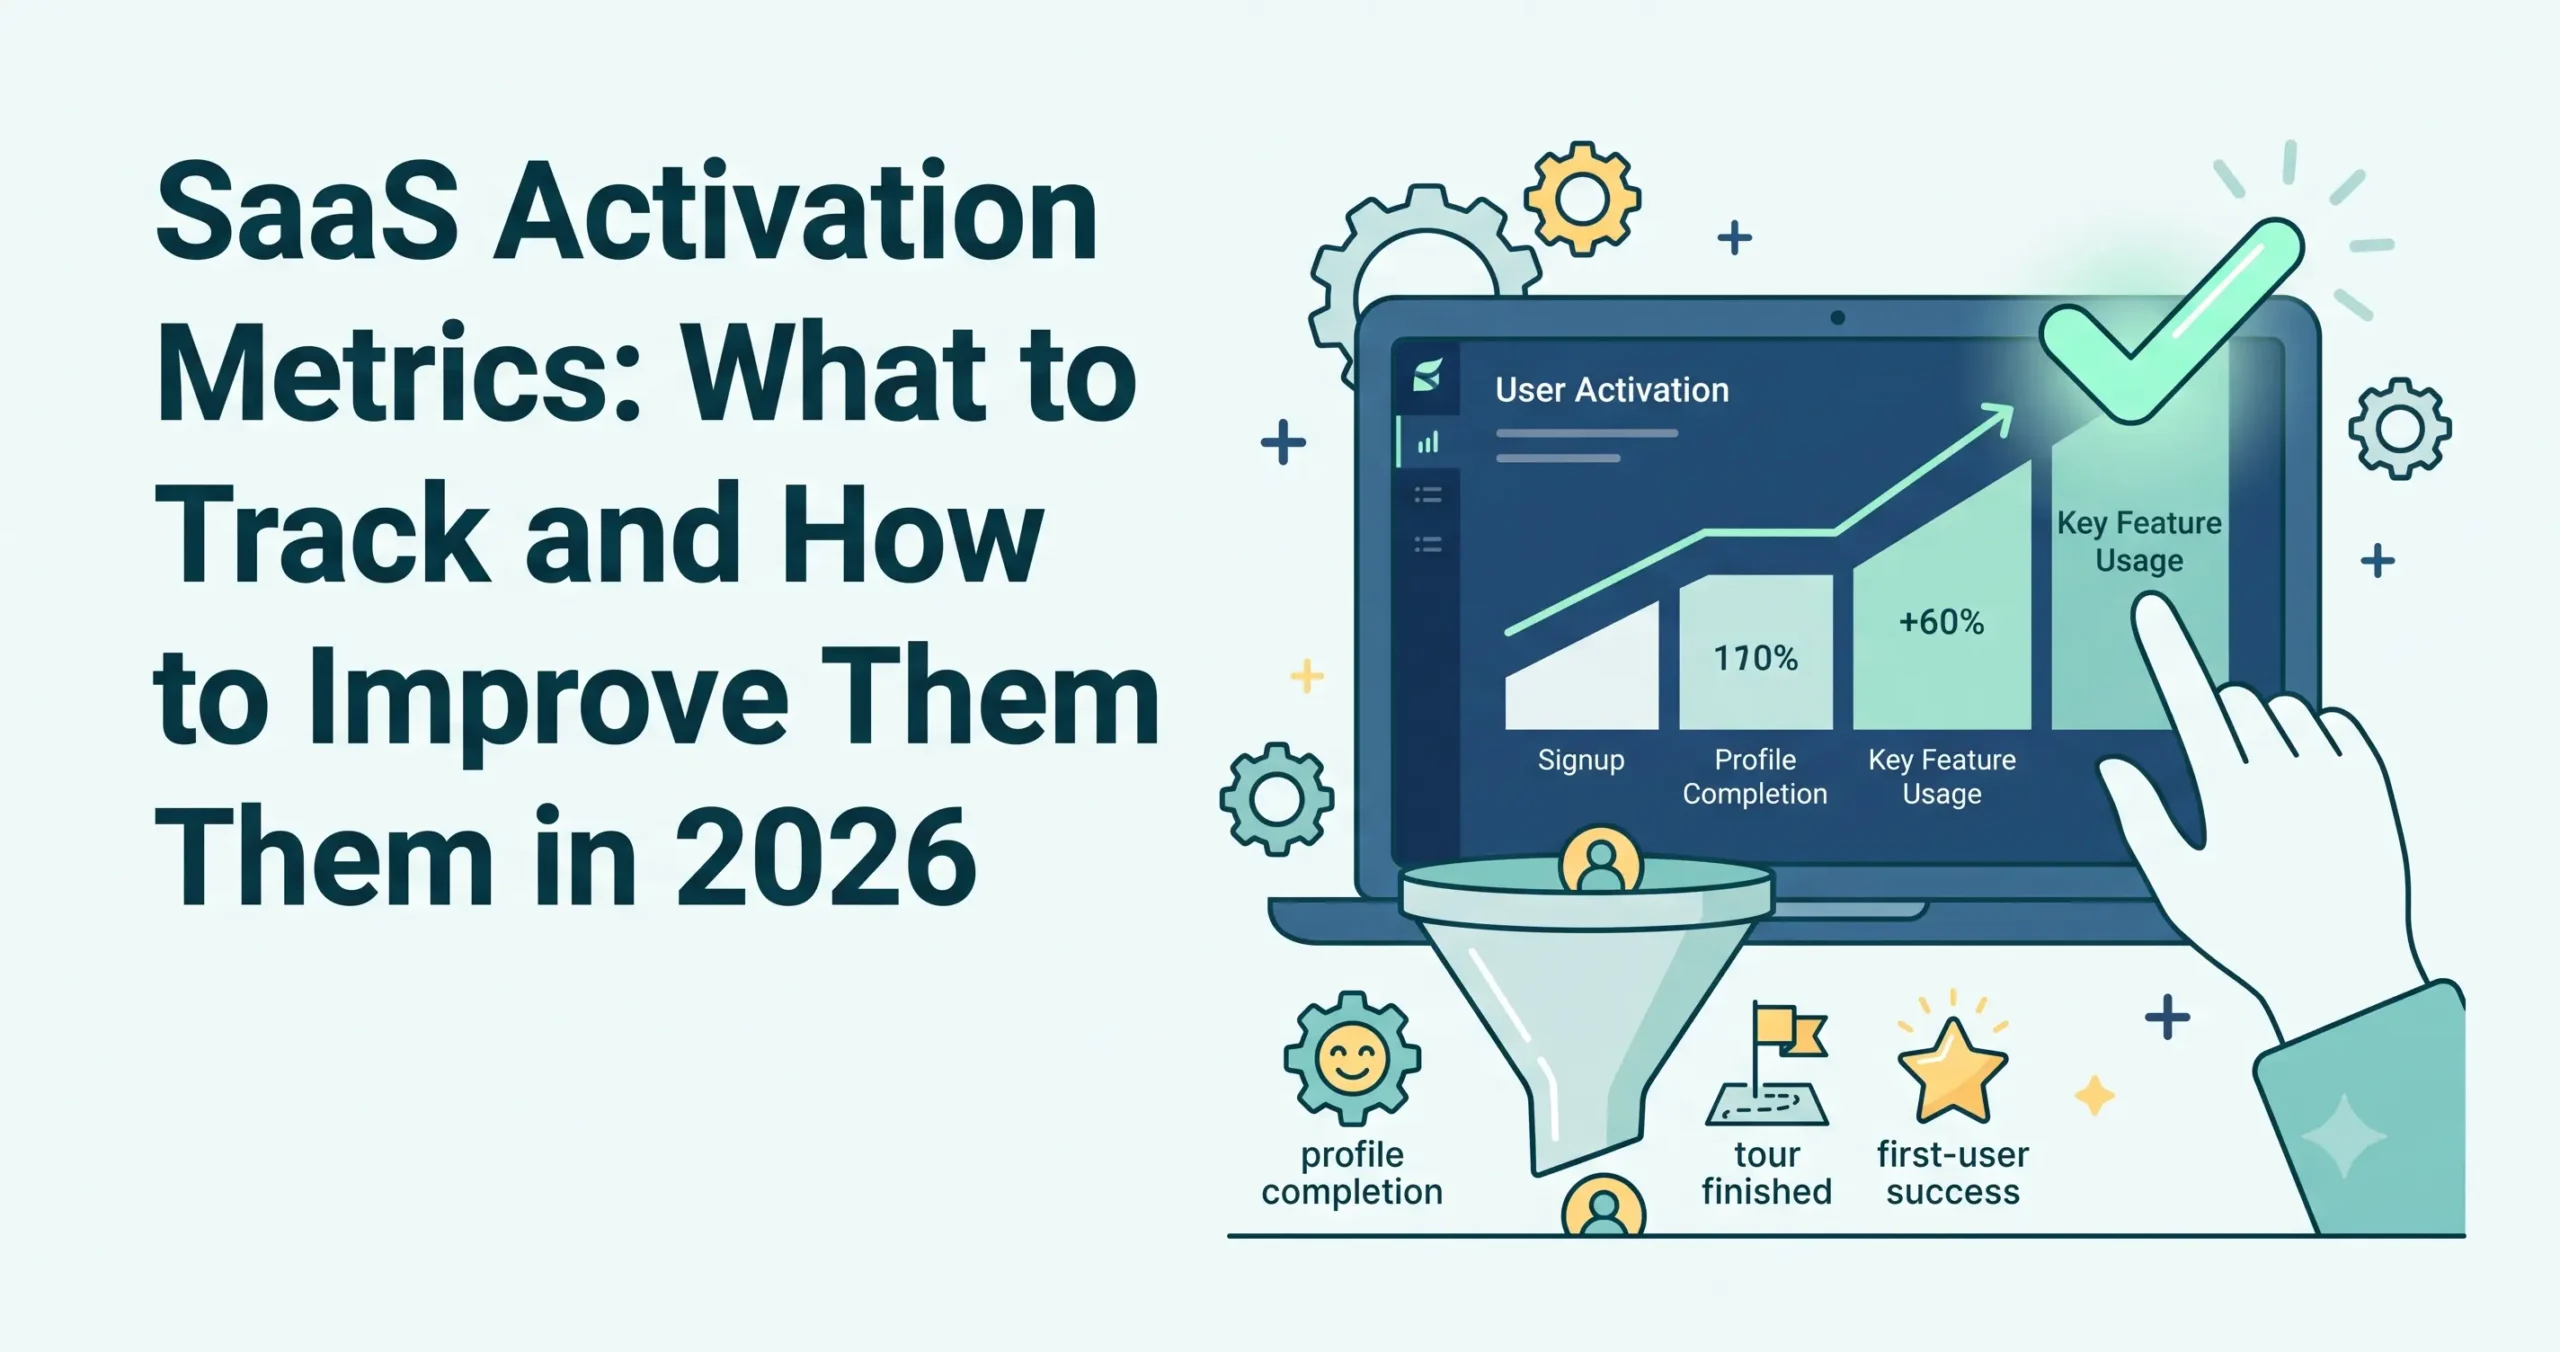
- The Activation Funnel: A step-by-step funnel visualization showing the journey from Signup → Setup Step 1 → Setup Step 2 → Activation Event. This instantly highlights where users are dropping off.
- TTV Histogram: A bar chart showing the distribution of how long it takes users to activate (e.g., 0-1 hour, 1-24 hours, 2-7 days).
- Activation by Cohort (Line Chart): A chart tracking your activation rate week-over-week or month-over-month. This helps you see if recent product updates or onboarding changes have positively impacted activation.
- Activation by Acquisition Channel: A table breaking down activation rates by marketing channel (e.g., Organic Search vs. Paid Ads vs. Referrals). This helps marketing understand which channels bring in the highest-quality, highest-intent users.
Step 3: Set Up Alerts
Don’t just look at the dashboard when things go wrong. Set up automated Slack or email alerts if the rolling 7-day activation rate drops below a certain threshold. Proactive monitoring prevents weeks of lost revenue.
6. Seven Tactics to Improve Your Activation Rate
Knowing your SaaS activation metrics is only half the battle. The ultimate goal is to improve them. Here are seven high-leverage tactics to guide users to value faster in 2026.
1. Radically Reduce Setup Friction
Every unnecessary form field, forced integration, or mandatory tutorial step degrades your activation rate. Audit your onboarding flow and ruthlessly eliminate friction. If you don’t strictly need a user’s phone number or company size on day one, don’t ask for it. Utilize Single Sign-On (SSO) like Google or Microsoft login to reduce friction, and consider delaying credit card requirements until the user has actually experienced the product’s value (reverse trial methodology).
2. Implement Personalized Onboarding Paths
A Chief Marketing Officer and a junior copywriter will use the same SEO software in entirely different ways. Stop forcing every user through an identical, monolithic onboarding tour. Ask one or two segmentation questions during signup (e.g., “What is your main goal today?” or “What is your role?”). Use that data to route them to a personalized in-app experience that highlights only the features relevant to their specific use case.
3. Provide Proactive, Contextual In-App Support
Users get stuck, and when they do, they rarely email support—they just close the tab. Counteract this by using intelligent in-app guidance. Use tooltips, pulsing hotspots, and embedded short-form video tutorials precisely where users tend to drop off in the activation funnel. Implementing an AI-driven chatbot that can answer “how-to” questions instantly within the product interface can also bridge the gap between confusion and activation.
4. Engineer “Quick Wins” Early
Time-to-Value is critical. If your product takes three weeks to set up (like a complex CRM), you need to engineer artificial quick wins to maintain momentum. Provide pre-built templates, populate the software with rich dummy data so the user can see what the end-state looks like, or offer a “magic import” feature that instantly migrates their data from a competitor. The faster they see a win, the more motivated they are to complete the hard setup work.
5. Utilize Gamification and Progress Psychology
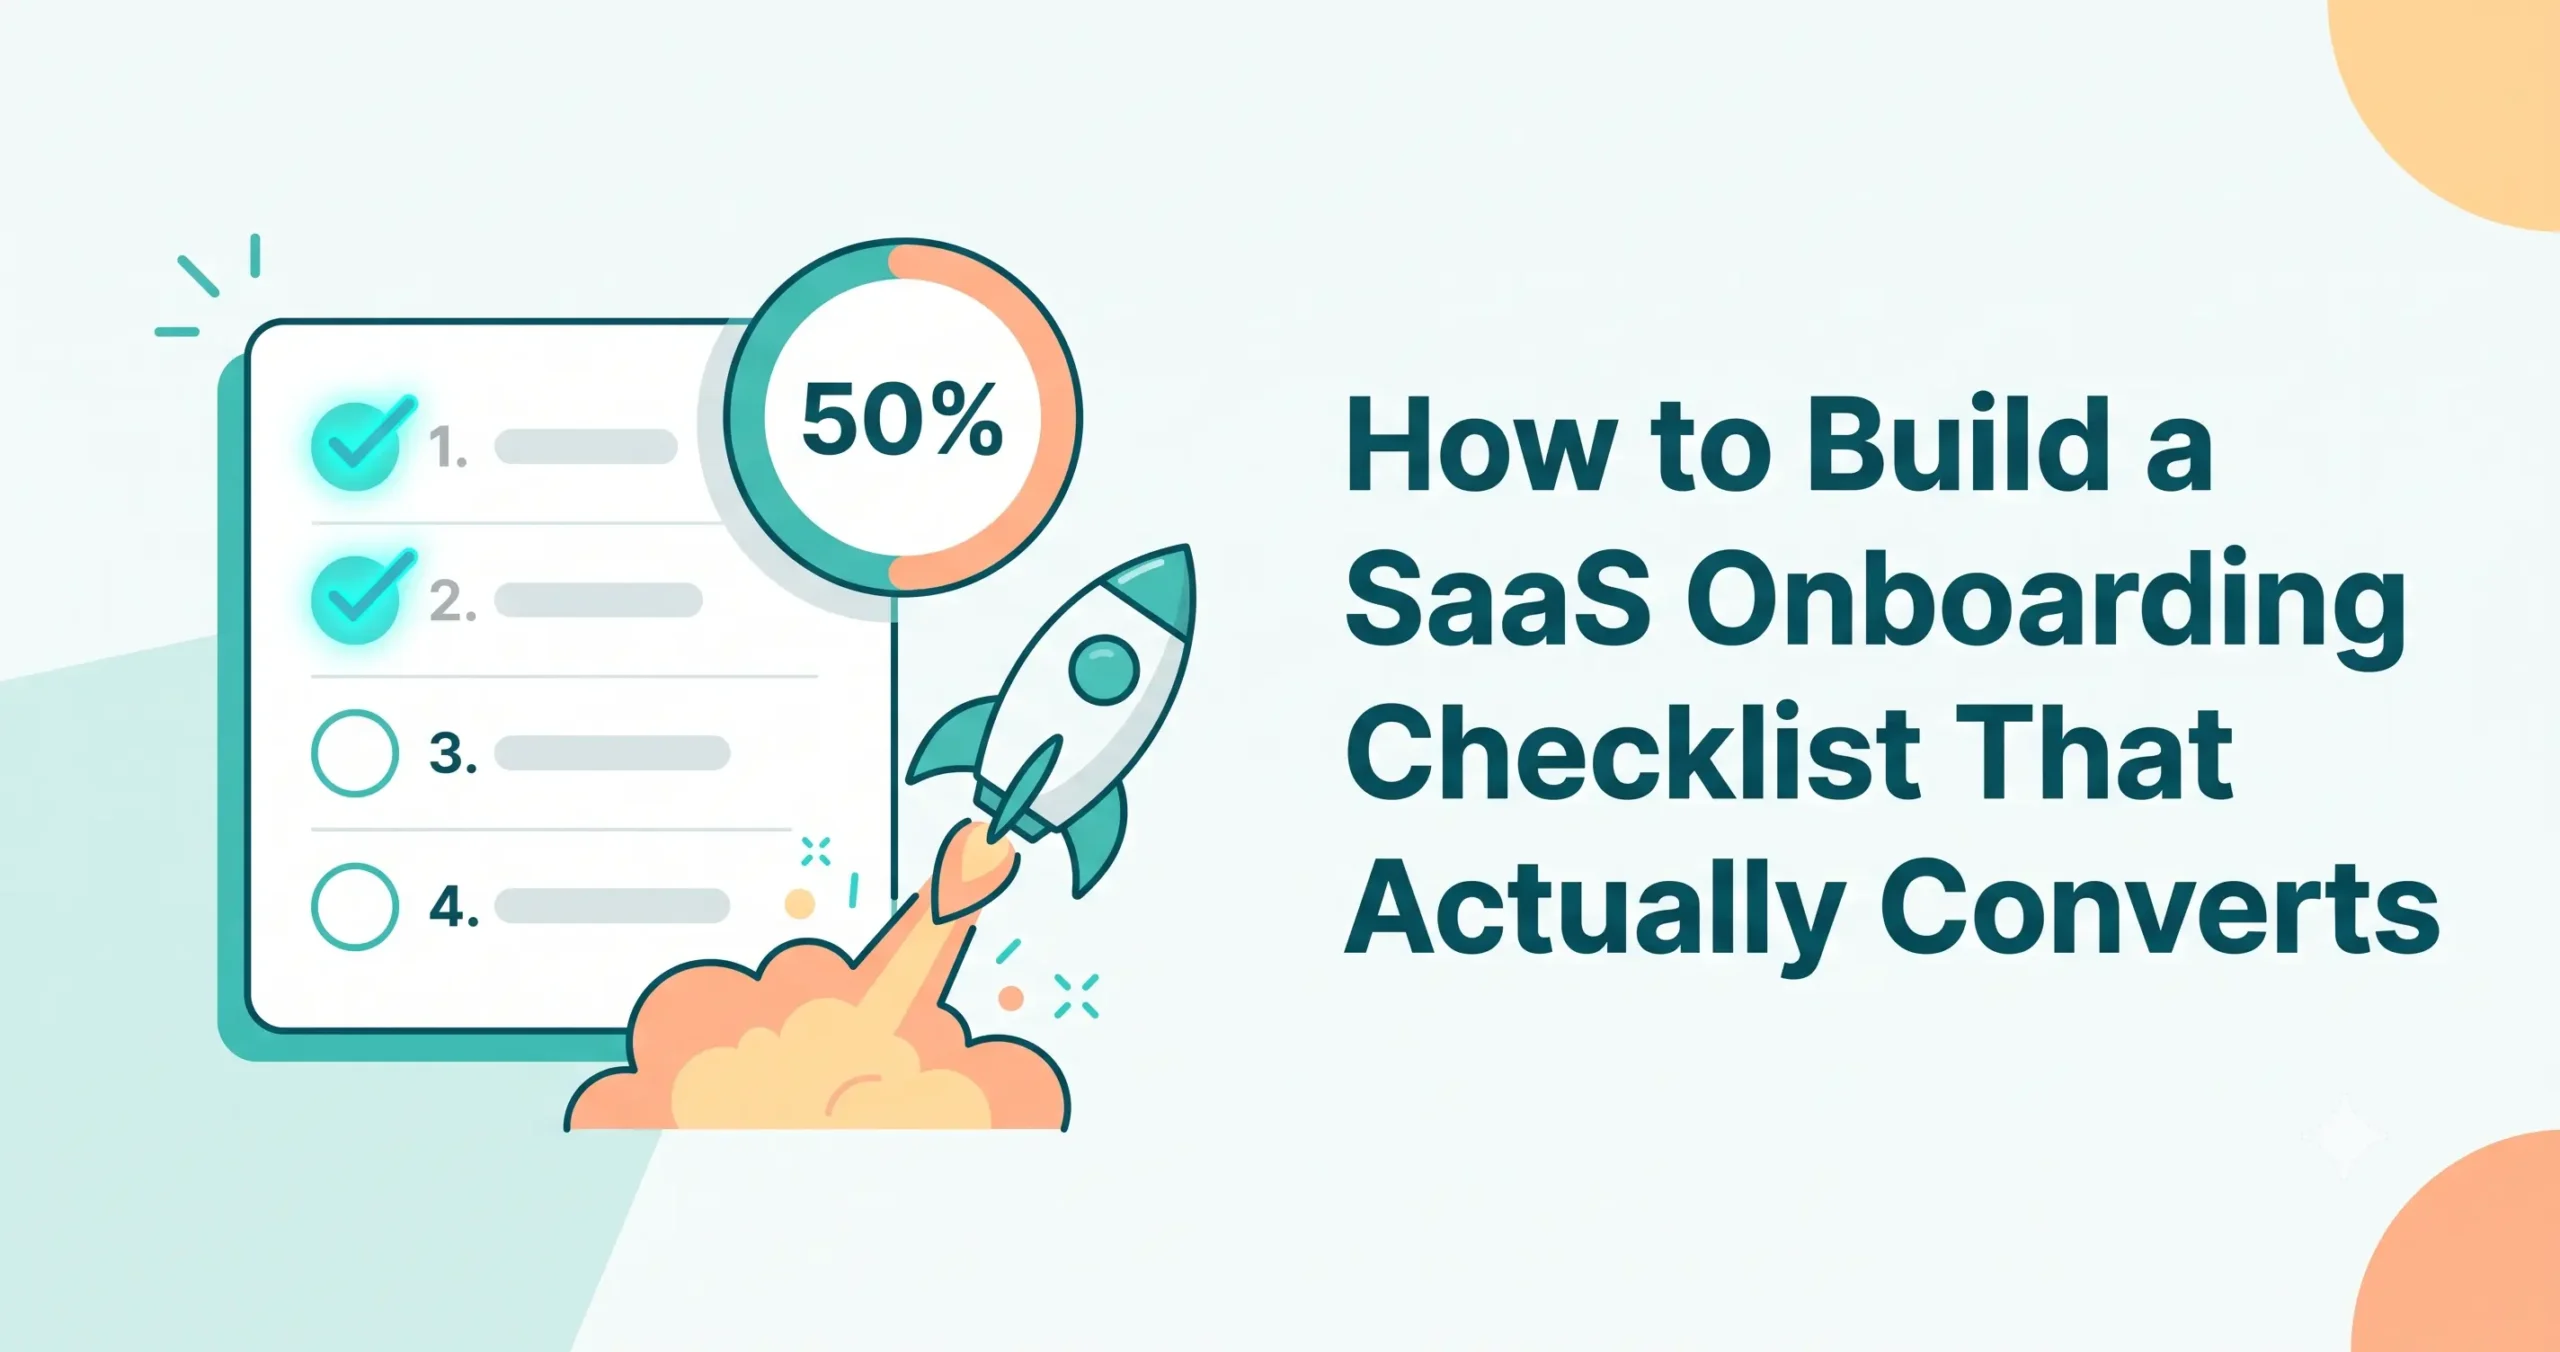
Humans are psychologically wired to want to complete unfinished tasks (the Zeigarnik effect). Leverage this in your onboarding by using progress bars, checklists, and achievement badges. A prominent “Getting Started” checklist that starts with the first item already crossed off (e.g., “✅ Create Account”) creates a sense of forward momentum that encourages users to complete the remaining steps to reach activation.
6. Trigger Intent-Based Lifecycle Emails
Onboarding doesn’t only happen inside the app. Your lifecycle email strategy must be tightly integrated with your SaaS activation metrics. Do not send generic “Day 3” or “Day 7” emails. Instead, trigger emails based on user behavior. If a user completes step 1 but abandons step 2 of the activation funnel, trigger a highly specific email 6 hours later offering help with step 2. Behavioral emails have exponentially higher open and click-through rates than chronological drip campaigns.
7. Add a Human Touch for High-Value Accounts (Product-Led Sales)
If you are operating a PLG motion, you can drastically boost activation for high-potential accounts by layering in human assistance. Monitor your signups for users matching your enterprise ICP (e.g., they sign up with a Fortune 500 domain). When these users enter the funnel, trigger an alert to your Sales or Customer Success team to reach out with a personalized, high-touch offer to help them get set up.
7. Common Measurement Mistakes
Even well-intentioned teams can get SaaS activation metrics wrong. Avoid these common pitfalls to ensure your data is actually helping you grow.
Mistake 1: Focusing on Vanity Metrics Over Actionable Metrics
Tracking “Daily Active Users” (DAU) or “Total Signups” feels good because the numbers always go up, but these are vanity metrics. A user logging in and staring at a blank dashboard counts as an “Active User” in most basic analytics setups, but they are not activated. Always tie your metrics back to the core value-driving behaviors, not just logins.
Mistake 2: Setting the Activation Bar Too Low (or Too High)
If your activation event is simply “uploading a profile picture,” your activation rate will look fantastic, but those users will still churn because they haven’t experienced real value. Conversely, if your activation event requires the user to invite 50 team members and integrate three APIs, your activation rate will be near zero. The activation event must be the exact tipping point where retention curves stabilize.
Mistake 3: Treating Activation as a One-Time Event
SaaS products evolve. You launch new features, new modules, and new tiers. Activation is not just for new users. You must measure “Secondary Activation”—how effectively are your existing users adopting the new features you release? A healthy SaaS business continuously activates its user base into deeper levels of the product.
Mistake 4: Not Segmenting the Data
Looking at a blended, aggregate activation rate is dangerous. An overall activation rate of 40% might hide the fact that users from paid ads are activating at 10%, while organic search users are activating at 70%. You must segment your SaaS activation metrics by acquisition channel, user persona, company size, and device type to uncover actionable insights.
Conclusion
Mastering SaaS activation metrics is not a one-time project; it is an ongoing operational cadence. In 2026, as software categories become more crowded and customer acquisition costs continue to rise, you can no longer afford to pour users into a leaky bucket.
By clearly defining your activation event, meticulously tracking Activation Rate, Time-to-Value, and Feature Adoption Depth, and implementing targeted tactics to reduce friction and guide users to value, you will build a sustainable, retention-driven growth engine. At NudgeSaaS, we view activation not just as a metric, but as the ultimate promise you keep to your users.
Core SaaS Activation Metrics Summary
Below is a quick reference table summarizing the critical metrics discussed in this guide.
| Metric Name | Definition | Why It Matters |
| Activation Rate | The percentage of signups who complete the product’s core value-realization event. | Indicates the overall health, usability, and immediate appeal of your onboarding experience. |
| Time-to-Value (TTV) | The average time (hours/days) it takes a new user to complete the activation event after signup. | Faster TTV strongly correlates with lower early-stage churn and higher user satisfaction. |
| Feature Adoption Depth | The percentage or number of core features a user interacts with during their initial lifecycle. | Highlights whether users are deeply embedding your tool into their workflow or just scratching the surface. |
| Product Qualified Leads (PQLs) | Activated users who fit your Ideal Customer Profile and show behavioral intent to upgrade. | Bridges the gap between product usage and revenue, giving sales teams highly qualified targets. |
Frequently Asked Questions (FAQ)
1. How often should we review and update our defined activation event?
You should review your activation event every 6 to 12 months, or whenever there is a major shift in your product’s core functionality or go-to-market strategy. As your product matures and adds new capabilities, the action that best predicts long-term retention may change.
2. Is user onboarding the same thing as user activation?
No. User onboarding is the process—the UI tours, emails, tutorials, and UX design—used to guide a user. User activation is the outcome or the goal of that process. Onboarding is what you do; activation is what the user achieves.
3. Can a user be considered “activated” if they haven’t paid yet?
Absolutely. In freemium and free-trial PLG models, activation almost always happens before payment. The purpose of activation is to prove the product’s value so convincingly that the user is eventually willing to cross the paywall.
4. Who owns SaaS activation metrics within a company?
In modern SaaS companies, activation is a cross-functional metric, usually spearheaded by a Growth Product Manager. However, Product designs the flow, Marketing drives the right intent, and Customer Success/Support handles the friction. It is a shared KPI.
5. How do we measure the “Aha! moment” if it’s emotional?
You can’t measure the emotion directly in a database, but you can identify the actions that surround it. Use qualitative methods like user interviews, session recordings (e.g., Hotjar), and post-onboarding surveys to ask users exactly when the product “clicked” for them. Then, map those qualitative answers to the quantitative behavioral events in your analytics to define your hard activation metric.